An earlier article in Research Design Review – “Finding Connections & Making Sense of Qualitative Data” – discusses the idea that a quality approach to a qualitative research design incorporates a carefully considered plan for analyzing and making sense of the data in order to produce outcomes that are  ultimately useful to the users of the research. Specifically, this article touches on the six recommended steps in the analysis process.* These steps might be thought of as a variation of the classic Braun & Clarke (2006) thematic analysis scheme in that the researcher begins by selecting a unit of analysis (and thus becoming familiar with the data) which is then followed by a coding process.
Unique to the six-step process outlined in the earlier RDR article is the step that comes after coding. Rather than immediately digging into the codes searching for themes, it is recommended that the researcher look through the codes to identify categories. These categories basically represent buckets of codes that are deemed to share a certain underlying construct or meaning. In the end, the researcher is left with any number of buckets filled with a few or many codes from which the researcher can identify patterns or themes in the data overall. Importantly, any of the codes within a category or bucket can (and probably will) be used to define more than one theme.
As an example, consider an in-depth interview study with financial managers of a large non-profit organization concerning their key considerations when selecting financial service providers. After the completion of 35 interviews, the researcher absorbs the content, selects the unit of analysis (the entire interview), and develops 75-100 descriptive codes. In the next phase of the process the researcher combs through the codes looking for participants’ thoughts/comments that convey similar broad meaning related to the research question(s). In doing so, the researcher might come up with five or six categories, including these three
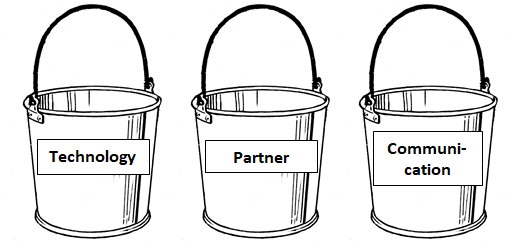
Each bucket contains various codes that help define the category. The next step is to look within and across these categories to derive themes based on participants’ similar meaning. In this example, the researcher extrapolated the theme “strong partnership” from codes in the Partner category – e.g., “pay attention to me,” “recommend new services or products,” and “be supportive” – and Communication codes – e.g., “communicate with me regularly” and “be responsive to my requests.” The theme “technical expertise” was developed from codes in the Technology bucket – e.g., “integrate software systems” and “utilize advanced credit card reporting” – as well as Partner codes – e.g., “offer creative solutions” and “help us with reporting.”
Any of the codes within the categories can be “re-used” to define multiple themes. So, for instance, one or more of the codes associated with the “strong partnership” and “technical expertise” themes might also help to identify the theme “experience and knowledge of the industry.”
No one said that qualitative data analysis is simple or straightforward. A reason for this lies in the fact that an important ingredient to the process is maintaining participants’ context and potential multiple meanings of the data. By identifying and analyzing categorical buckets, the researcher respects this multi-faceted reality and ultimately reaps the reward of useful interpretations of the data.
*Based on the Total Quality Framework. This framework and six general steps in qualitative research analysis are discussed fully in Applied Qualitative Research Design: A Total Quality Framework Approach (Roller, M. R. & Lavrakas, P. J., 2015. New York: Guilford Press).

The most important concept – focus on producing outcomes that the users of the research can use. That frame will be very helpful in creating the initial buckets.
LikeLike
Yes. The all-important Usefulness component to qualitative research design!
LikeLike
Reblogged this on Managementpublic.
LikeLike